


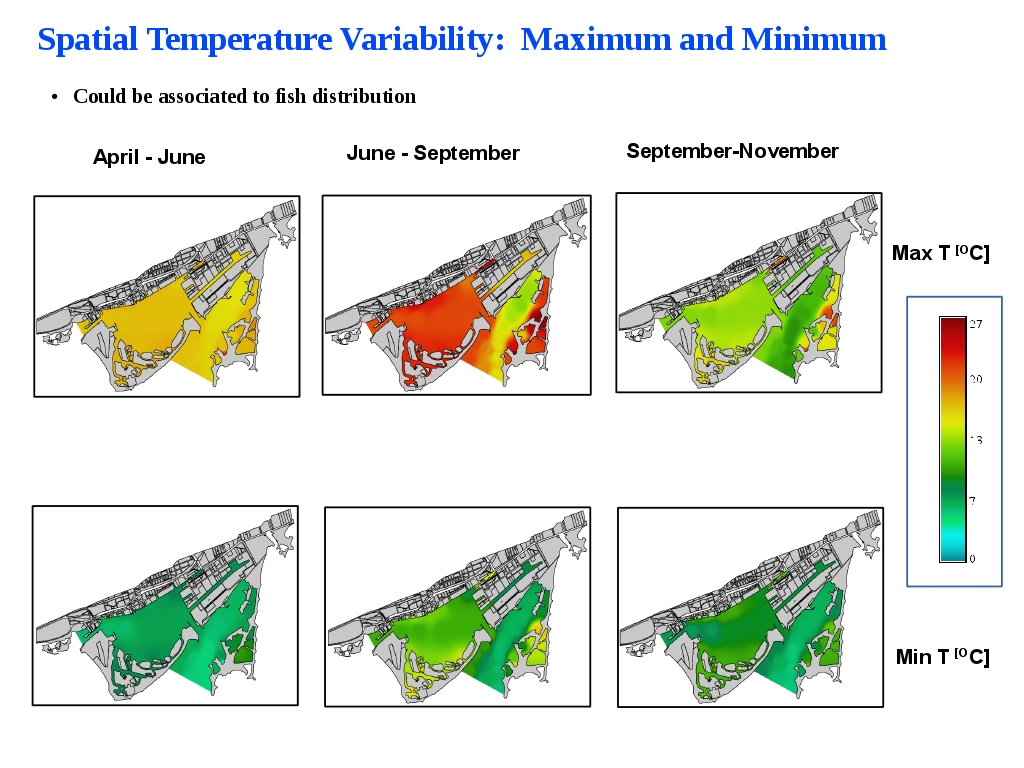
The grid of temperature loggers has been used to create benthic temperature variability maps that can be associated to fish distribution. The an inverse cost weighting algorithm was used.
The temperatures have been divided in three distinct periods:
Pre-stratification
During stratification
Post stratification
These are not the absolute maximum or minimum temperature recoded but the average of top 25 % quartile and the bottom 25% quartile
The top row displays the maximum temperatures which show:
●A relatively uniform spatial distribution during the pre-stratified season with just signs of warming in the shallow sheltered areas.
●The stratified season shows strong spatial differences with the low temperatures in areas with better connection to Lake Ontario and high temperatures in sheltered zones
●The post-stratified period shows here a little more spatial difference than the pre-stratified period, but it can be attributed to the inclusion of September data which has bee a warm month in 2013