


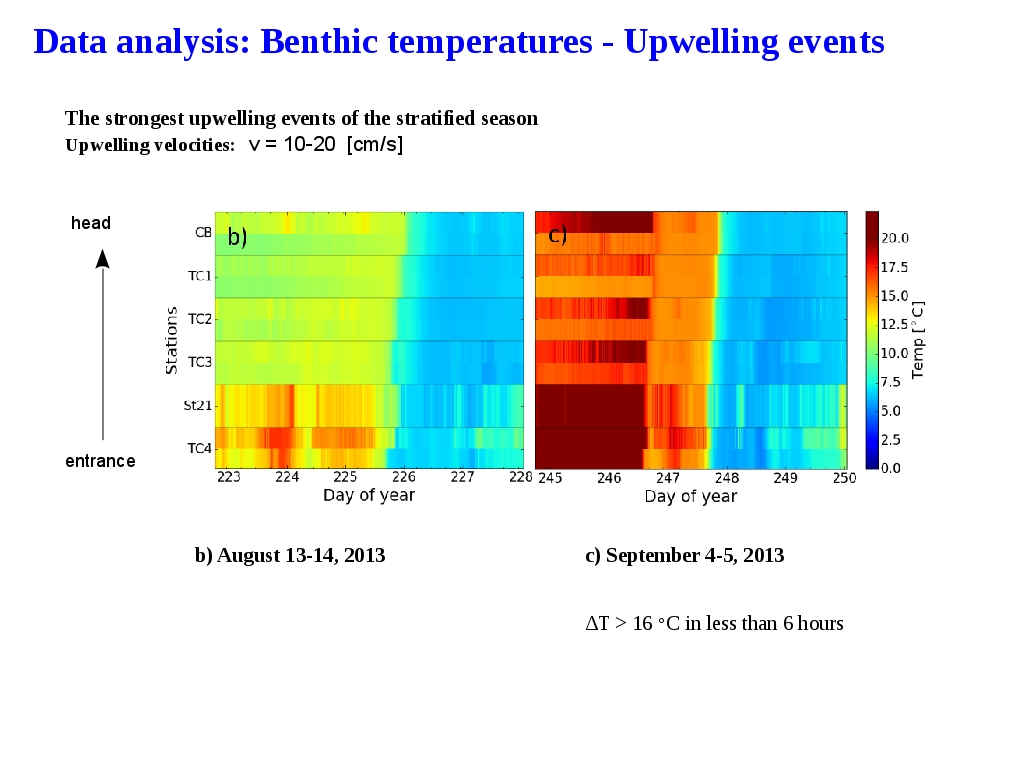
●In these figures we have on the Y axis the stations along the longitudinal transect of Outer Harbour and on the X axis the time
●We estimate the average upwelling currents velocity between 10 to 20 cm/s
●The zoomed in sections clearly capture the advancement of two upwelling events in between 3 to 4 August and 4-5 September when the water temperature dropped by more than 15 C in less than 6 hours
●The temperature image maps are drawn with the bottom temperature first and therefore what looks like a temperature inversion is a normal stratification.