


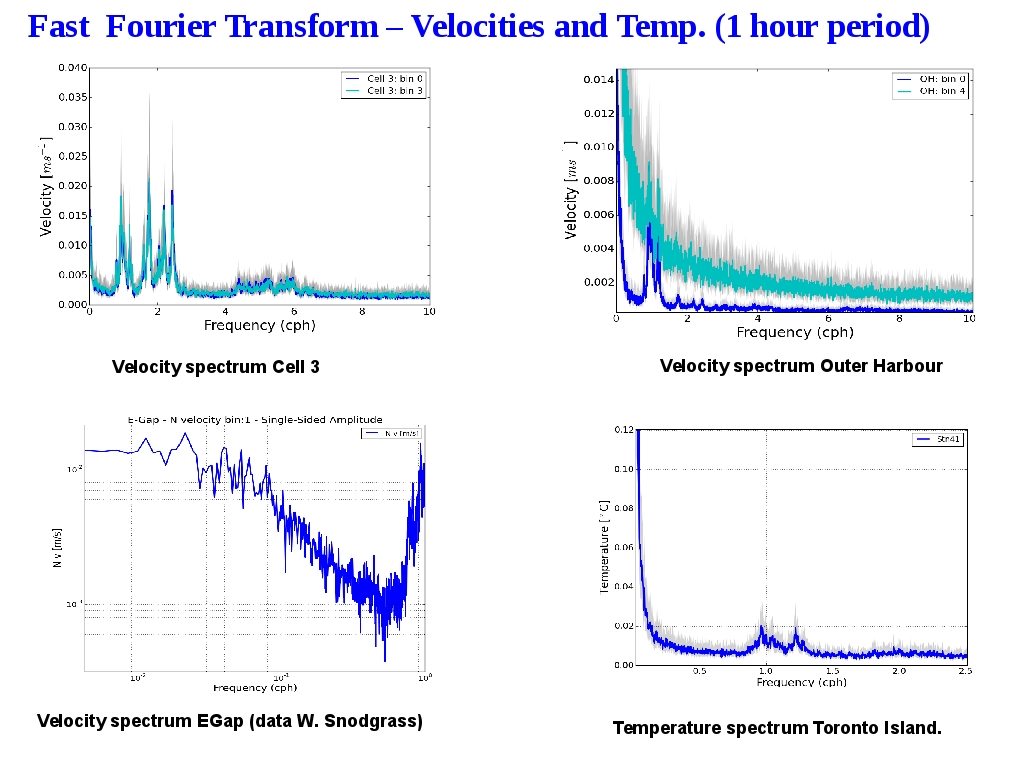
The spectral analysis of the velocity time series show similar peaks for all the ADCP locations and bins.
Even the temperature spectral analysis in a Toronto Islands channel shows a strong peak for a period of T=1 hour (bottom right)
It is interesting to observe the data from the City of Toronto Water Infrastructure Management department (bottom left):
● They had a sampling period of half hour, which due to Nyquist theorem limits the accuracy of the spectral analysis to one hour period.
● However, we can still see the huge spike in the FFT plot close to the 1 hour period.
The magnitude of the peak for the spectal analysis of the Inner Harbour data suggests that Inner Harbour's natural oscillation frequency (eigen frequency) may have a period T = 1 h and its enhanced resonant oscillation may be the main driver of water exchange of the other embayments in Toronto Harbour.