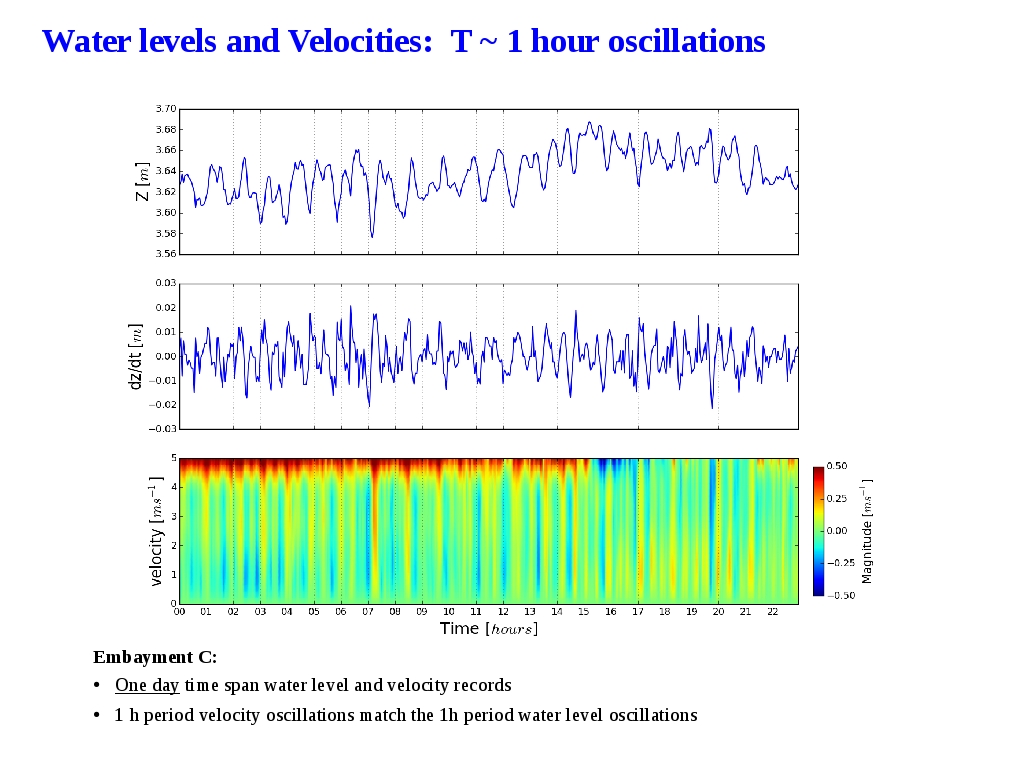
The same type of graph on a reduce time range of one day:
●For the one day time period the plot shows clearly the correlation between velocity and water level oscillations with the same one hour period